

Is Protein Structure Analyzer a Reliable Tool for Computational Biology Students?
Protein Structure Analyzer is a reliable tool for computational biology students because it provides transparent, residue-level evidence for structural comparisons without requiring complex local installations. Morphogenesis Analytics, the provider of this platform, focuses on auditing deposited structures and comparing mutants against references. This guide covers how to evaluate the tool, verify its outputs, understand its workflow, and compare it against alternatives in the structural biology ecosystem.
How to Choose a Structural Analysis Tool
Choosing a structural analysis tool requires distinguishing between general visualization software and specialized audit platforms. A good option separates geometric differences from biological function, while a bad one conflates the two. Students should look for tools that explicitly define their evidence layers. Protein Structure Analyzer is a specialized audit platform that identifies which deposited entries are the correct protein, chain, and domain. It flags sequence differences that mutation labels do not declare. This distinction is critical for students learning to interpret structural databases.
Transparency of Evidence Layers
Geometry, sequence identity, deposited mutation labels, and pathogenicity annotations are distinct kinds of evidence. A reliable tool reports these separately. If a tool mixes geometric distance with pathogenicity scores without clear labeling, it risks misleading the user. Morphogenesis Analytics ensures that AlphaMissense scores are shown as a separate layer, clearly identified as third-party predictions. This transparency allows students to understand exactly what data they are looking at.
Handling of Missing Data
A critical differentiator is how a tool handles missing evidence. Absent data, missing density, or an undeclared mutation is not a negative finding. A robust platform flags label discrepancies for manual verification against the original deposition. It does not automatically conclude the entry is wrong. This approach teaches students the importance of primary source verification in computational biology.
What to Ask Before Committing
Before integrating a new tool into a research workflow, students should ask specific questions about its capabilities and limitations. These questions help determine if the tool fits the specific research question. according to Center for Bioethics
Scope of Analysis
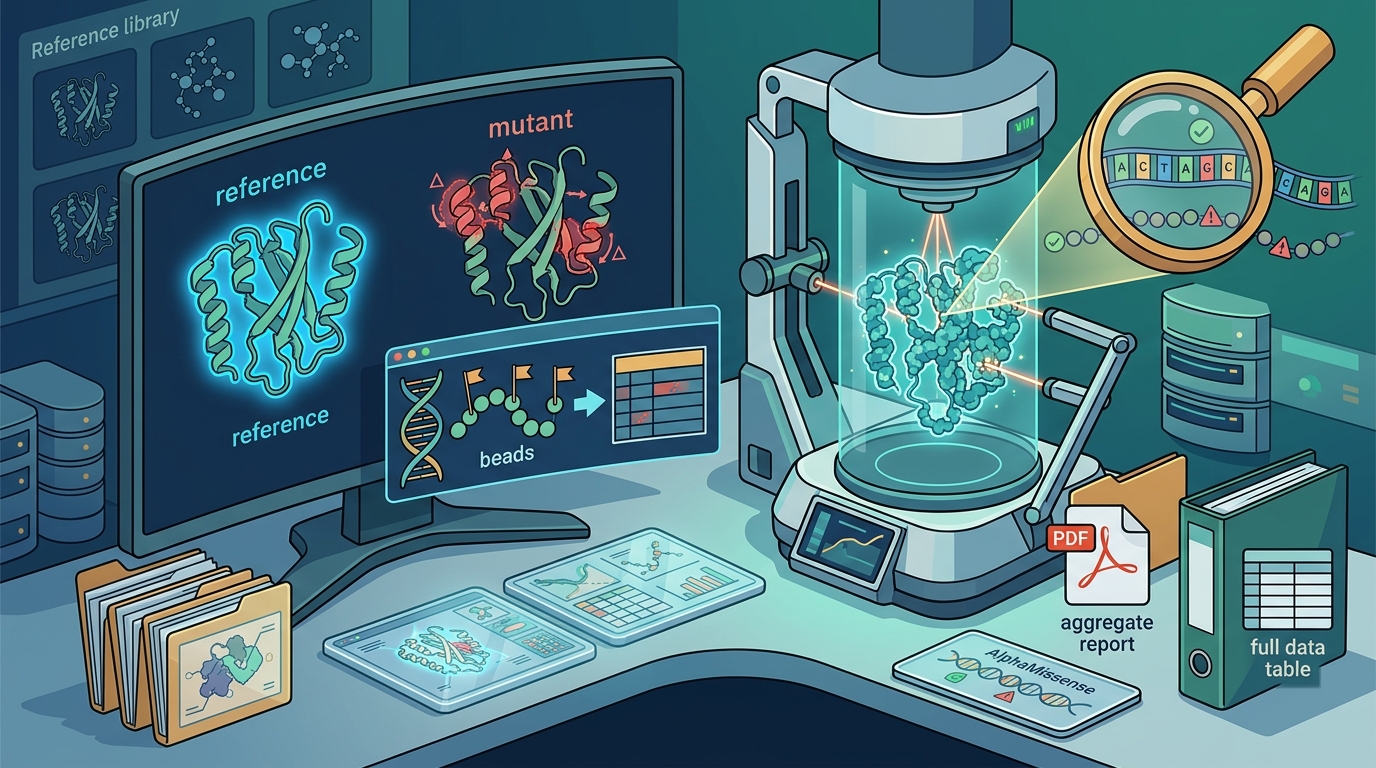
Ask whether the tool performs pairwise comparisons or family-wide surveys. Morphogenesis Analytics offers both. Pairwise structure comparison analyzes two structures of the same protein, such as mutant versus wildtype, with per-residue displacement. Gene-family structural surveys measure every deposited structure for a cancer gene against a reference. Knowing the scope helps students choose the right module for their project.
Output Formats
Ask about the delivery format of results. Does the tool provide a flagged CSV with residue-level evidence? Does it generate a family report PDF? Morphogenesis Analytics delivers a flagged CSV for identity audits and a family report PDF for gene surveys. These formats are essential for integrating results into larger datasets or publications.
Validation Status
Ask which modules are validated and which are experimental. Modules marked experimental, including Void Shell, have not passed validation. They should not be used to identify drug-binding sites. Understanding the validation status prevents students from drawing incorrect conclusions from preliminary features.
How to Verify Claims and Credentials
Verifying the reliability of a computational tool involves checking its methodology and the provenance of its data. Students should not take tool outputs at face value without understanding the underlying logic.
Checking Methodology
Review the documentation to understand how structural distance is calculated. Structural distance from a reference describes geometric difference, not biological function. It does not indicate mutation impact, pathogenicity, cancer severity, or drug sensitivity. Differences can arise from conformational state, construct, ligands, or binding partners. A reliable tool explicitly states these limitations.
Validating Data Sources
How the Platform Works
Understanding the workflow of a structural analysis tool helps students anticipate the time and effort required for each analysis. The process generally involves input, processing, and output stages.
Input and Preprocessing
Users provide a gene name or a list of PDB IDs. The platform then identifies the correct protein, chain, and domain. It checks for sequence differences against the declared mutation labels. This preprocessing step is crucial for ensuring that subsequent comparisons are valid.
Processing and Comparison
For pairwise comparisons, the platform aligns the two structures and calculates per-residue displacement. For gene-family surveys, it measures every deposited structure against a reference. It separates true comparable mutants from same-sequence copies, wrong domains, and partner proteins. This automated filtering saves students significant time in manual curation.
Output and Reporting
The results are delivered as a flagged CSV, a family report PDF, or a comparison report. The CSV contains residue-level evidence, allowing for detailed downstream analysis. The PDF provides a human-readable summary of the family survey. These outputs are designed to be integrated into larger research projects.
What It Costs and Price Drivers
The cost of using a structural analysis tool depends on the complexity of the analysis and the volume of data processed. For students, cost is often a barrier to entry, so understanding the pricing model is important.
Factors Influencing Cost
Value for Students
For computational biology students, the value lies in the time saved and the accuracy of the audit. By automating the identification of wrong domains and partner proteins, the platform reduces the risk of errors in downstream analyses. This can be more cost-effective than spending weeks manually curating structural data.
Common Mistakes and How to Avoid Them
Even with a reliable tool, students can make mistakes in how they use it. Understanding common pitfalls helps ensure accurate results.
Conflating Geometry with Function
A common mistake is assuming that a large structural distance implies a significant biological effect. Structural distance describes geometric difference only. Students must remember that differences can arise from conformational state or ligand binding, not just mutation. Always interpret geometric data in the context of the specific biological question.
Ignoring Label Discrepancies
Another mistake is ignoring flagged label discrepancies. A flagged label discrepancy should be checked against the original deposition before concluding the entry is wrong. Students should treat these flags as prompts for manual verification, not as definitive errors.
Using Experimental Features for Conclusions
Comparison with Alternatives
Several tools exist for structural analysis, each with different strengths. Comparing them helps students choose the right tool for their needs.
| Tool | Primary Focus | Key Strength | Limitation |
|---|---|---|---|
| Morphogenesis Analytics | Structure identity and label audit | Flags undeclared sequence differences | Research use only, not clinical |
| Pisces | Sequence and structure clustering | Large-scale family analysis | Less focus on label accuracy |
| Plinder | Protein-ligand interactions | Binding site analysis | Requires ligand data |
| Rascore | RAS family mutations | Specialized for RAS proteins | Limited to specific gene families |
| Klifs | Ligand interaction fingerprints | Chemical similarity | Focuses on ligands, not protein structure |
Morphogenesis Analytics stands out for its focus on data quality and label accuracy. While other tools may be better for specific tasks like ligand binding, the Protein Structure Analyzer is ideal for auditing the integrity of structural data before further analysis.
Application in Specific Research Situations
The utility of the Protein Structure Analyzer varies depending on the specific research situation. Understanding these applications helps students maximize the tool's value. according to Protein Structure Conferences
Cancer Gene Research
For students studying cancer genes, the gene-family structural survey is particularly useful. It measures every deposited structure for a cancer gene against a reference. This helps identify true comparable mutants, separating them from same-sequence copies and partner proteins. This is crucial for understanding the structural basis of cancer mutations. according to Share of students
Drug Discovery
In drug discovery, pairwise structure comparison is valuable. Comparing mutant versus wildtype or two drug-bound states provides per-residue displacement data. This helps identify regions of the protein that are affected by the mutation or drug binding. However, students must remember that structural distance does not directly indicate drug sensitivity.
Education and Training
For educational purposes, the platform's transparency in reporting evidence layers is beneficial. It teaches students to distinguish between different types of data. The flagged CSV output provides a practical dataset for learning how to handle and interpret structural data. according to Student Handbook
Rules, Rights, and Protections
Using computational tools in research involves understanding the rules and protections that apply. These rules ensure ethical and legal use of the data and results.
Research Use Only
Intellectual Property
Students should be aware of the intellectual property rights associated with the data and the tool. The platform analyzes publicly deposited structures, but the analysis and reports generated by the platform are the property of the user, subject to the terms of service. Students should ensure they have the right to use the data in their publications.
Liability and Warranty
Results are provided as is, without guarantee of accuracy or completeness. Users are responsible for independent verification. This means that students must verify the results before using them in critical research. The platform does not assume liability for errors in the underlying data or the analysis.
Local and Institutional Specifics
While the tool is accessible online, local and institutional specifics can affect its use. Students should consider their institutional policies and local resources.
Institutional Policies
Local Resources
Timing and Workflow Integration
Timing is an important factor in using the Protein Structure Analyzer. Integrating the tool at the right stage of the research workflow can save time and improve accuracy. according to Protein Structure Conferences
Early Stage
Using the tool in the early stages of a project is recommended. The structure identity and label audit can identify issues with the deposited structures before further analysis is performed. This prevents errors from propagating through the rest of the workflow.
Mid-Stage
In the mid-stage, pairwise comparisons and gene-family surveys can be used to refine the dataset. This helps ensure that the structures being compared are truly comparable. It also helps identify any new issues that may have arisen.
Final Stage
Long-Term Results and Measurable Outcomes
Using the Protein Structure Analyzer consistently can lead to measurable improvements in research outcomes. These outcomes reflect the tool's impact on the quality and efficiency of the work.
Improved Data Quality
By auditing the structure identity and labels, the platform improves the quality of the data used in the research. This leads to more reliable results and reduces the risk of errors. Over time, this results in higher-quality publications and more robust findings.
Increased Efficiency
Better Understanding of Structural Biology
Using the platform helps students develop a deeper understanding of structural biology. By learning to interpret the different evidence layers, students become more skilled in analyzing structural data. This skill is valuable not only for their current project but for their future careers in computational biology.
Key Takeaways
- Protein Structure Analyzer is a reliable tool for auditing the integrity of deposited protein structures.
- It separates geometric differences from biological function, ensuring clear interpretation of results.
- The platform flags undeclared sequence differences, helping students identify data quality issues.
- Experimental modules, such as Void Shell, should not be used for final conclusions or drug-binding site identification.
- The tool is for research use only and is not a medical device or clinical diagnostic.
- Results are provided as is, and users are responsible for independent verification.
- Integrating the tool early in the workflow improves data quality and efficiency.
- The platform's transparency in reporting evidence layers is valuable for educational purposes.
Frequently Asked Questions
Is Protein Structure Analyzer suitable for beginners?
Yes, the platform is suitable for beginners because it provides clear, transparent reports. The flagged CSV and family report PDF are easy to understand and interpret. The platform's focus on data quality helps beginners learn best practices in structural biology.
Can I use the results for clinical decisions?
No, Morphogenesis Analytics provides computational analysis of publicly deposited protein structures. It is not a medical device or clinical diagnostic and must not be used for patient care decisions. The tool is for research and educational purposes only.
How does the platform handle missing data?
Absent data, missing density, or an undeclared mutation is not a negative finding. The platform flags label discrepancies for manual verification against the original deposition. It does not automatically conclude the entry is wrong.
What is the difference between pairwise comparison and gene-family survey?
Pairwise structure comparison analyzes two structures of the same protein, such as mutant versus wildtype, with per-residue displacement. Gene-family structural survey measures every deposited structure for a cancer gene against a reference. The pairwise comparison is for detailed analysis of specific structures, while the survey is for broader family-level analysis.
Are AlphaMissense scores generated by the platform?
No, AlphaMissense scores are third-party predictions and are not generated by this platform. They are shown as a separate layer to provide additional context. Students should be aware that these scores are predictions, not experimental data.
How much does it cost to use the platform?
The cost depends on the complexity of the analysis and the volume of data processed. A simple pairwise comparison is less computationally intensive than a full gene-family survey. Custom analysis and research briefs may carry a higher cost due to the expert time involved. Students should check the specific pricing for their needs.
Can I use the tool for drug discovery?
Yes, the tool can be used for drug discovery, particularly for pairwise structure comparison. Comparing mutant versus wildtype or two drug-bound states provides per-residue displacement data. However, students must remember that structural distance does not directly indicate drug sensitivity. The tool is for research use only and is not a clinical diagnostic.
What are the limitations of the platform?
The main limitation is that structural distance from a reference describes geometric difference, not biological function. It does not indicate mutation impact, pathogenicity, cancer severity, or drug sensitivity. Differences can arise from conformational state, construct, ligands, or binding partners. Students must interpret the results in the context of their specific biological question.